We measured our carbon footprint for the first time – and saw how many things we are already doing right
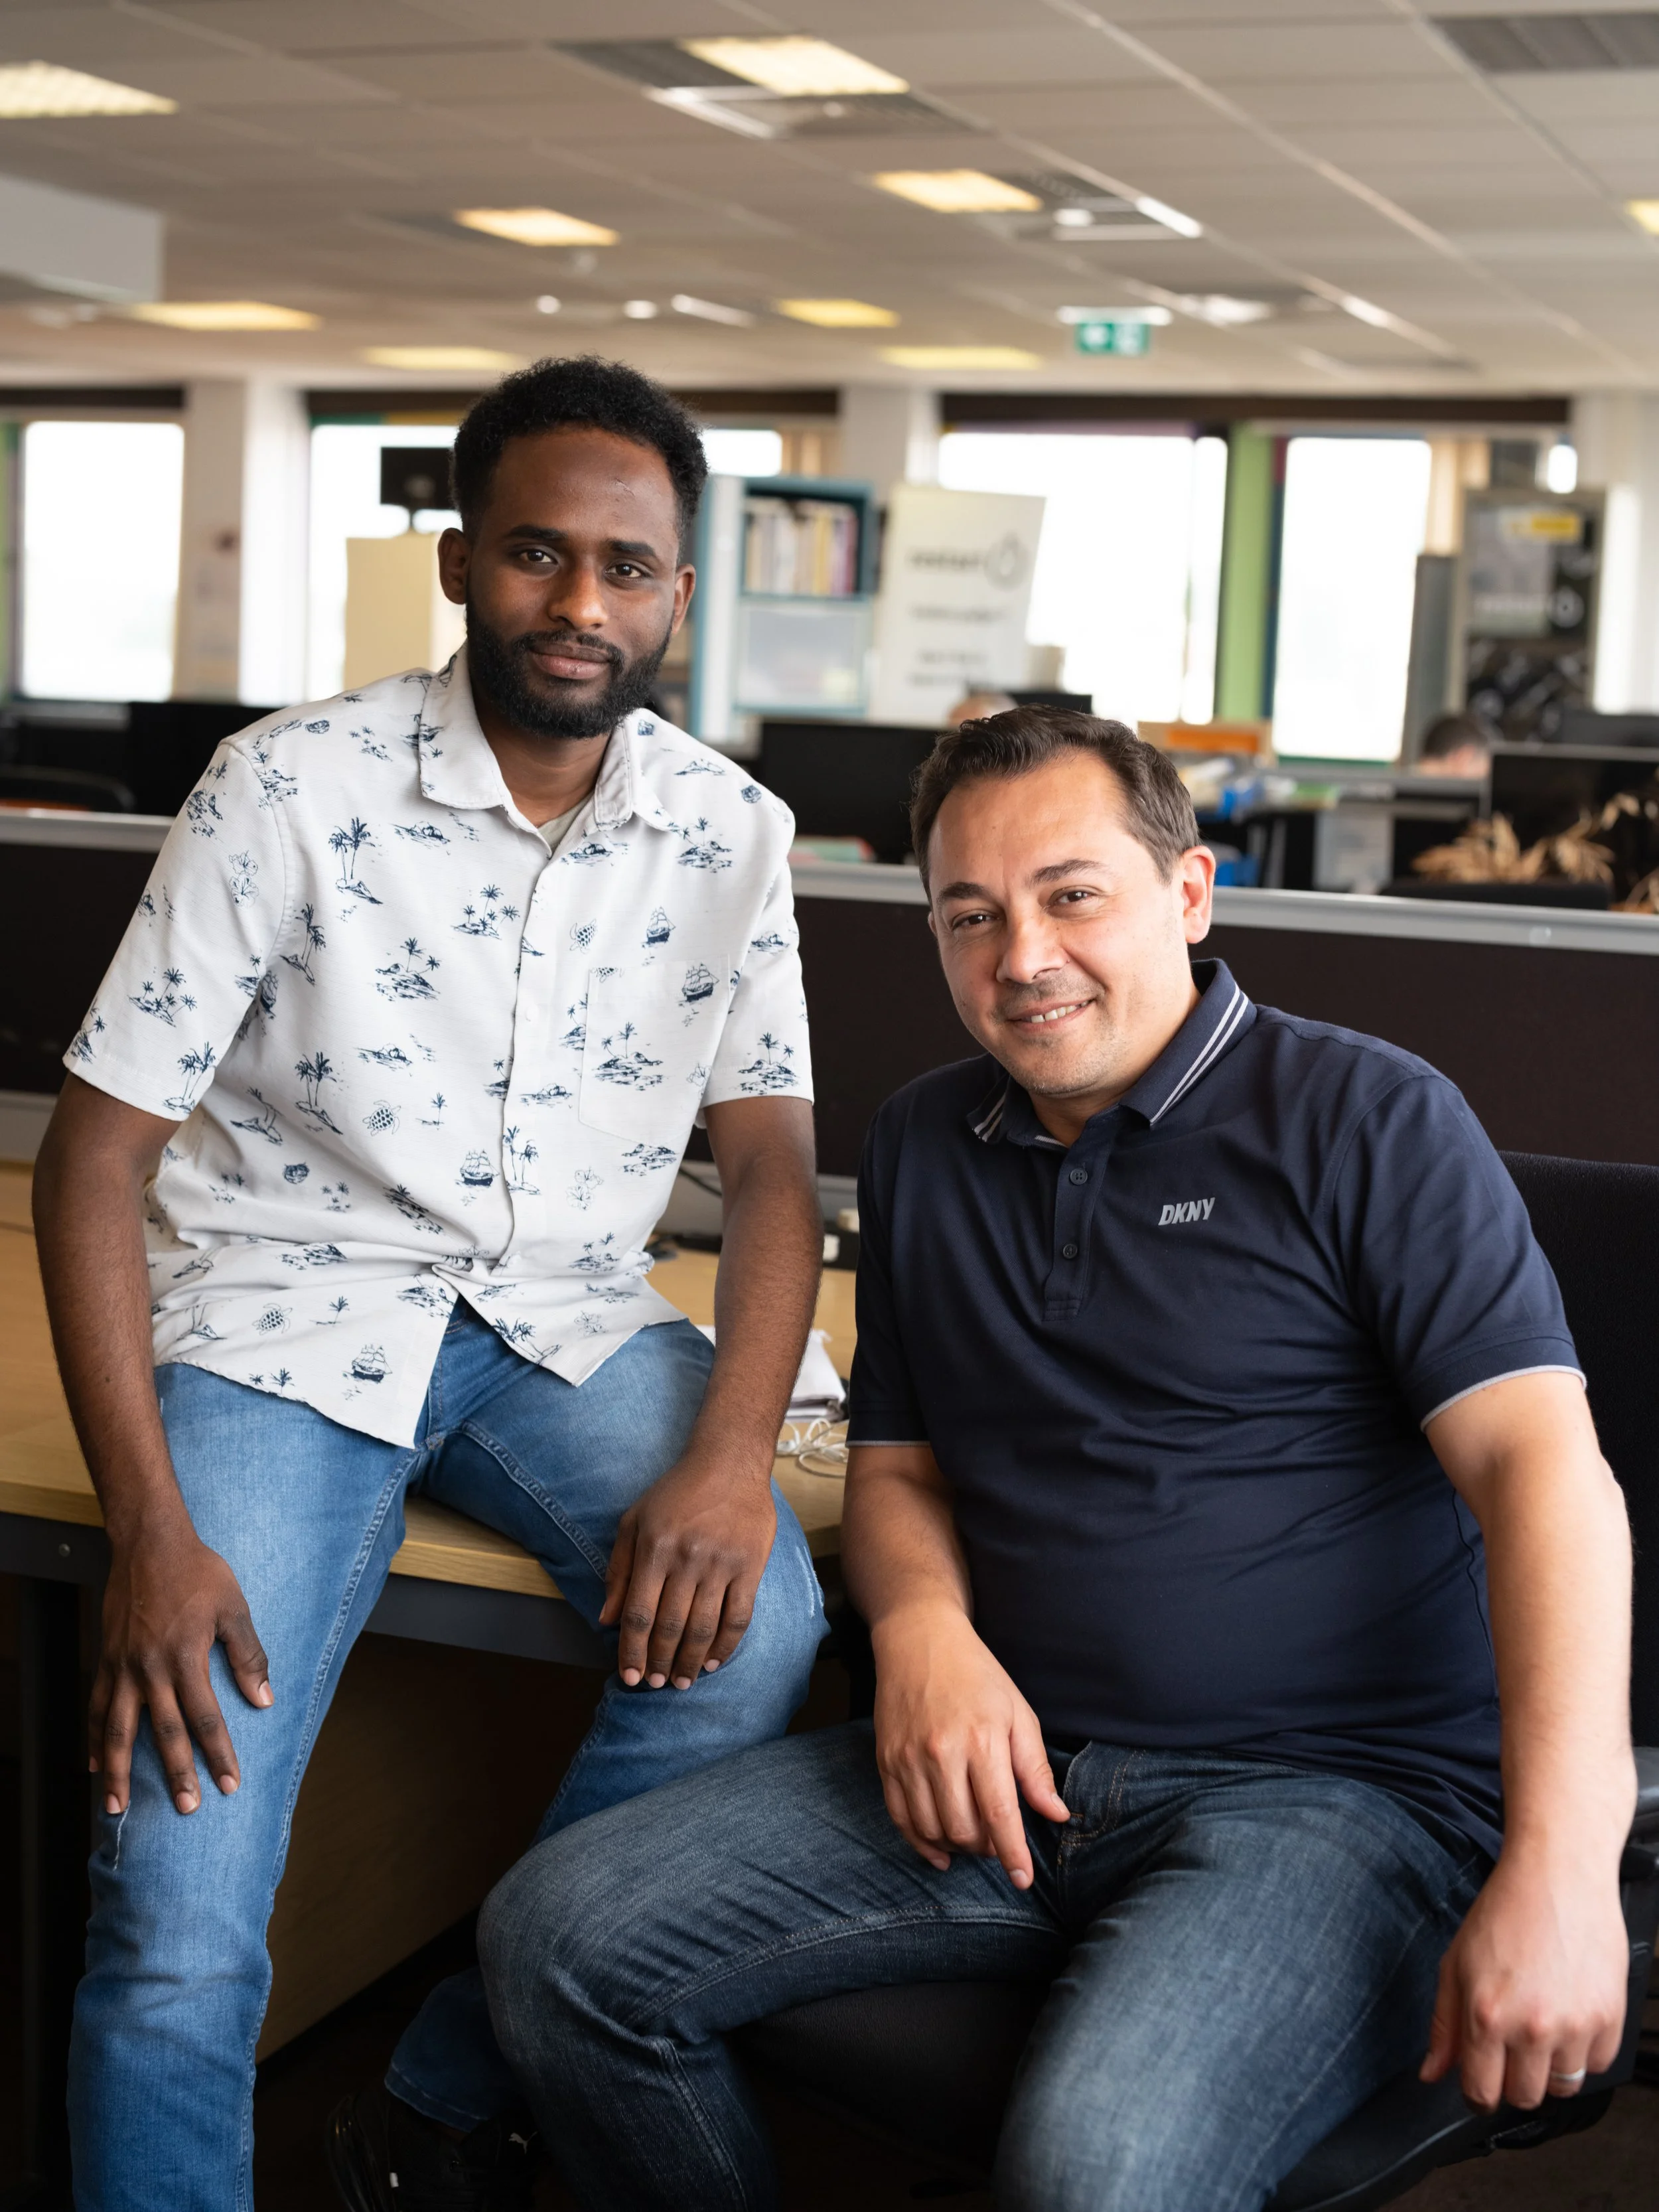
This year we partnered with On Purpose – a career change programme that guides organisations towards a healthy and more sustainable economic system. Their Associate Maria Fletcher spent 6 months with us looking at our supply chain, measuring our carbon footprint, and helping us create a vision for the future where we can become net zero.
So, what is carbon footprint and scopes?
Carbon footprint means how much greenhouse gas emissions Breadwinners as an organisation emits into the atmosphere. It is not just how much electricity we use in the office – our carbon footprint includes all the emissions in our supply chain starting from farmers who grew crops that were then milled and baked to become bread and then delivered to the market stalls and our wholesale clients. There are many organisations that released greenhouse gases along our supply chain – and they are counted as our emissions too.
In carbon accounting emissions are divided into “scopes” – scope 1 means carbon emissions released into the atmosphere from sources owned by a reporting company (such as own boilers or own vehicles). Scope 2 includes emissions from electricity, gas, heating and cooling in an organisation’s office. And scope 3 (the most complex one) accounts for all emissions released within a company’s supply chain that are not directly controlled by that company.
How did we measure it?
Every activity has a footprint – whether you turned on a switch, baked a loaf in an oven or drove a van to a Sunday market.
Let’s take an example. When a van drives 5 miles it emits some greenhouse gases – and someone (normally, a government department like DEFRA or DESNZ) has already measured how much a van of this size and type emits per mile. They issue a set of what is called “emissions factors” - numbers that represent how much greenhouse gases are emitted by a van per mile. The basic principle of calculating a carbon footprint is simple: take a unit of activity data and multiply it by an emissions factor relevant to that activity. For example, to estimate emissions from a van route, you multiply the emissions factor by the number of miles driven. Then add up all the miles across all routes over the course of a year – and we can find out total emissions from deliveries per year. The same logic applies to other activities too.
The challenging part is to get all the necessary data about all the operations of your organisation and its supply chain. And to make sure you got the right emissions factor for them.
Collecting data from your suppliers can be challenging, particularly when they are SMEs with limited resources, such as time and human capacity, or when you have numerous suppliers or long supply chains. Sometimes, they may not have the data you need. For example, our mill partner delivers tons of flour to our bakery partner, but they don't track how much of that flour is allocated to Breadwinners. In such cases, a spend-based method can be used — multiplying the amount of money spent on certain goods or services by the emissions factor for those goods or services. The emissions factor, in this case, represents the amount of CO2e emitted per pound spent.
We used the spend-based method to calculate the biggest category of our emissions - purchased goods and services - for us it is our bread and pastries.
What did we find out?
The biggest part of our carbon emissions comes from the supply chain – scope 3 (and according to Deloitte for many businesses this category accounts for 70% of emissions).
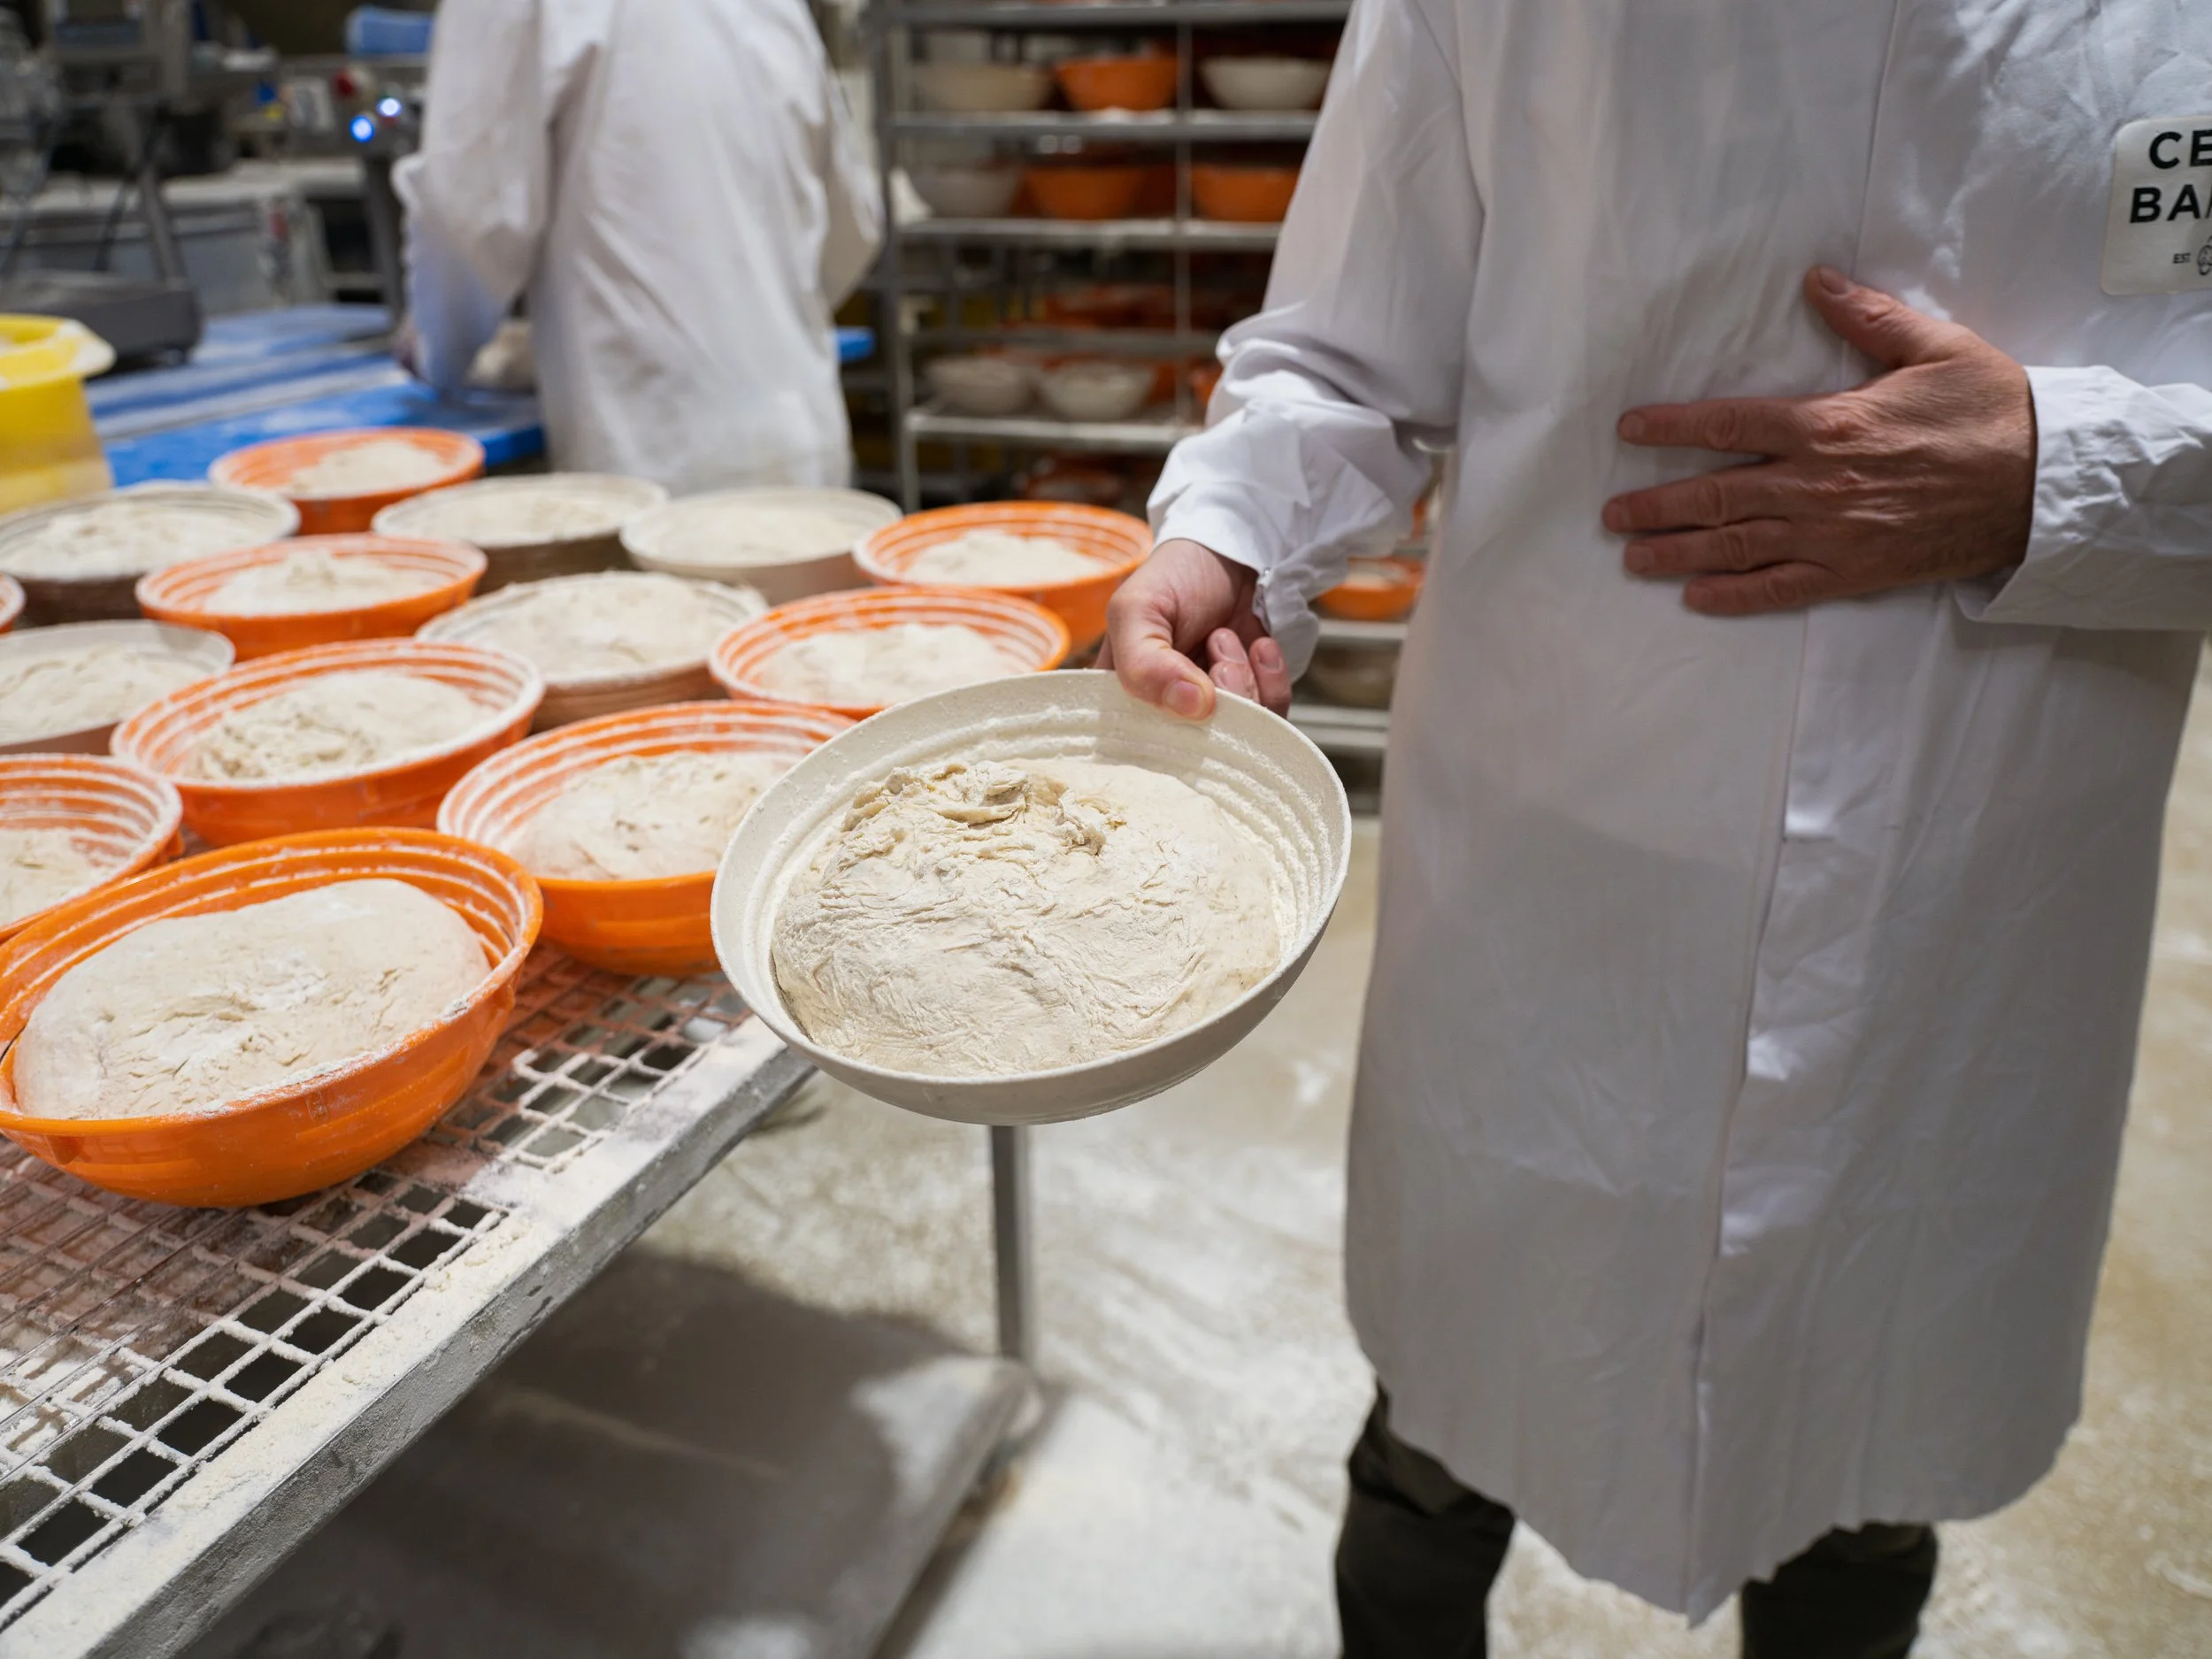
Within Scope 3, there’s a category that accounts for emissions that come from purchased goods – for Breadwinners this includes all the bread and pastries we buy from our trusted bakery. Each loaf tells a long “story” of emissions – from the farmers growing wheat and using machinery to cultivate and harvest it, to the mill where it’s cleaned, sifted, ground, and packaged, to the truck that delivers the flour – and finally, to the bakery where it’s baked into bread. All these activities have their own carbon footprint. This is why it’s the largest part of our emissions (41,875.25 kg of CO₂e) – and the one we have the least control over.

What we can do is make careful choices about what we buy and who we buy it from. One of the major decisions we’ve made is to only purchase certified organic bread. Organic farming avoids synthetic pesticides and fertilisers, promotes healthier soils, protects water systems from chemical runoff, and emits 16%–25% less carbon per kilogram of product compared to conventional farming. It not only reduces our environmental impact but also helps build a more regenerative food system. (You can read more about the benefits of organic flour in this blog post).
We deliberately choose partners who work hard to integrate sustainability practices into their operations – and by doing so we also help reduce our indirect Scope 3 emissions. Our two main suppliers – Shipton Mill and Celtic Bakers – are both powered by renewable energy, which significantly lowers the indirect emissions associated with our products. In the future we hope to carry out a more detailed assessment of our Scope 3 emissions to estimate the role renewable energy plays in the emissions embodied in bread and baked goods.
Shipton mill has been making significant strides towards becoming sustainable: they eliminated plastic packaging from their website retail orders. 80% of their lorries are powered by Euro 6 engines - the cleanest currently available. Offices and water are heated using the excess heat from the milling process. And they also plant lots of trees (take a look at their Torosay rewilding project in Scotland)!
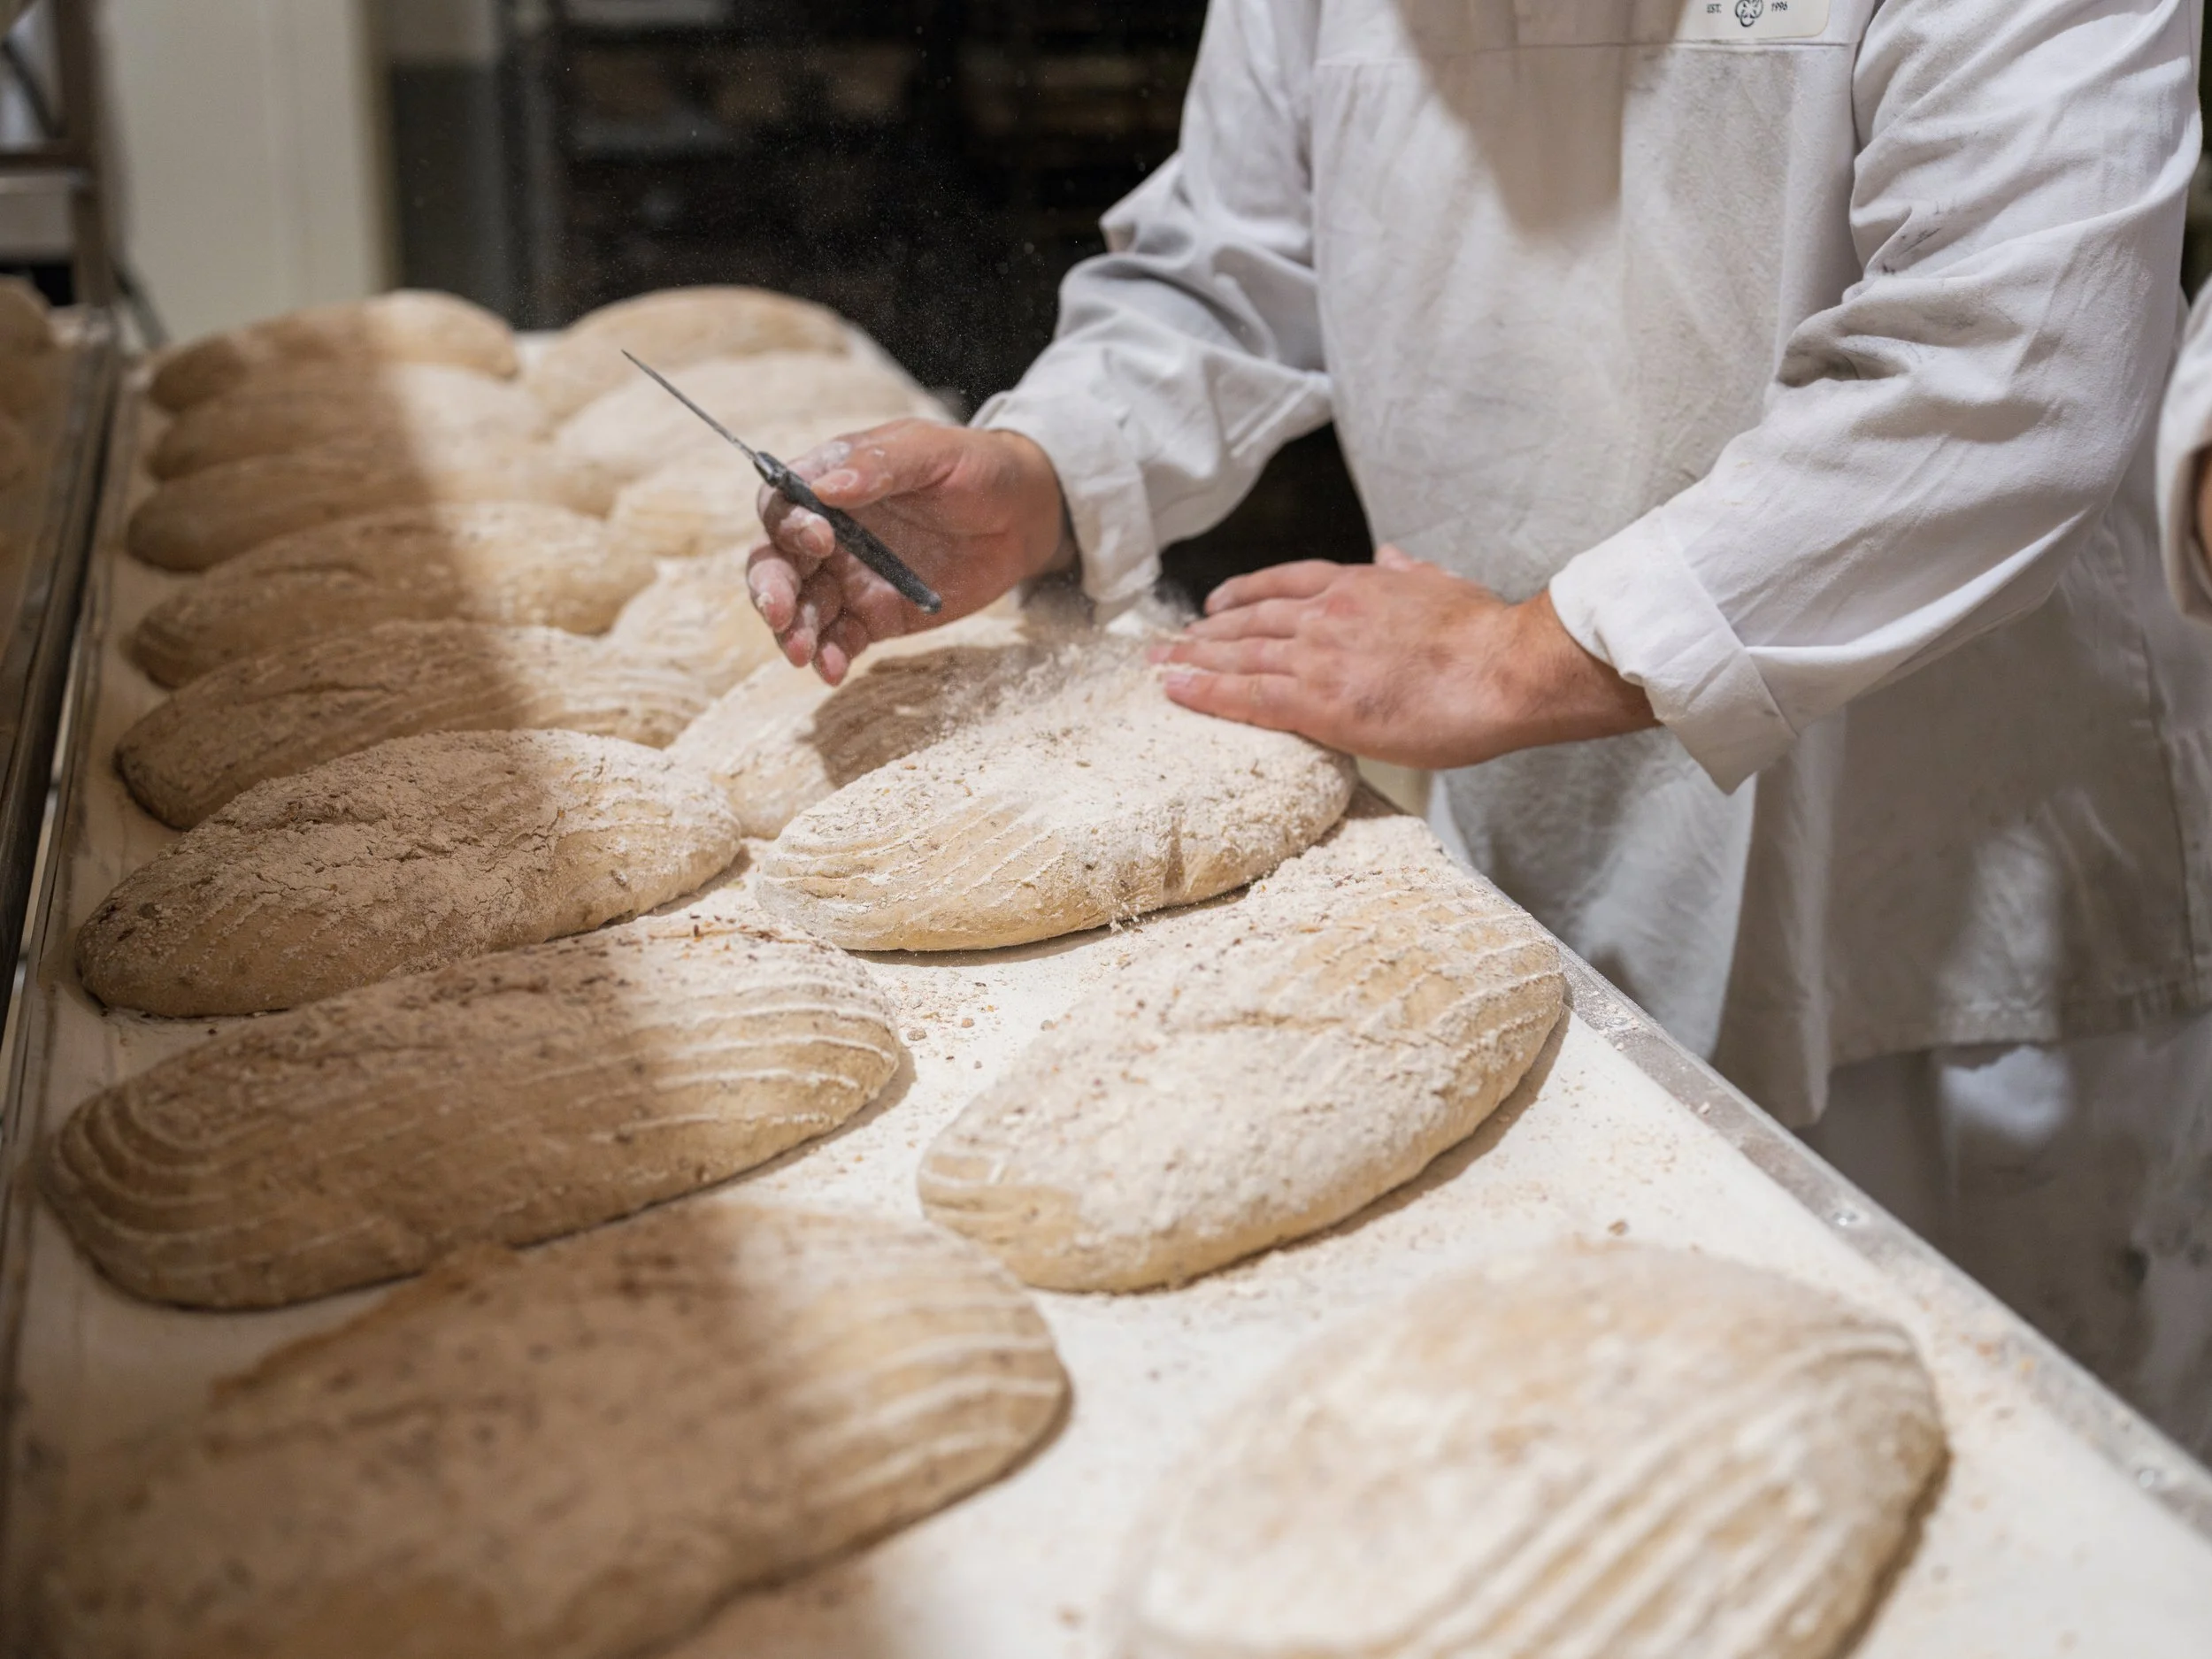
Our partner bakery, Celtic Bakers, is zero waste – they donate 100% of their food waste to charities. Food waste is responsible for 10% of global emissions and uses 25% of all freshwater - that’s why it is important not to waste food. Zero waste is a key part of our carbon strategy too – we donate 100% of our surplus food through Too Good To Go, which has already helped us save 35 metric tons of CO₂e overall, including 7.89 metric tons in the past year alone.
Logistics and distribution are another significant part of our carbon footprint (3,029.11 kg of CO₂e in the past year) – and they represent our biggest opportunity for carbon reduction. Our logistics partner’s wholesale vans are powered by Euro 6 engines, and to further reduce emissions, they use route optimisation software for our market deliveries, helping to cut down on unnecessary mileage and fuel consumption. However, diesel vans are still fossil fuel-based. As a next step towards zero-emissions deliveries, we are reviewing options to gradually transition our wholesale and market deliveries to electric vans.
When we looked at upstream logistics in our supply chain, we found that the mill uses its own lorries to deliver flour to the bakery. Right now, the UK simply doesn’t have the infrastructure to electrrify heavy goods vehicles (HGVs), which means switching the lorry fleet to electric isn’t possible yet. The grains that aren’t grown in the UK are delivered to the mill by sea, which is much cleaner than air freight.
When it comes to our own emissions – our electricity and gas footprint is just 348.3 kg of CO₂e a year because we share an office space and come to the office only once a week. Our employee commuting emissions are tiny as well - 186.67 kg of CO₂e. All our full-time employees either use public transportation, cycle or walk to work.
What have we learnt and what’s next?
We learnt that what sets us apart is our ability to combine deep social impact with meaningful climate action - proving that it’s possible to run a purpose-driven, commercially viable social enterprise that cares equally for people and the planet.
Breadwinners is part of the food sector – one of the biggest contributors to global greenhouse gas emissions. Aware of our role in this system, we took decisive steps this year to measure our carbon footprint. The results gave us a clearer picture of our impact and set the stage for focused, data-led plans to cut emissions. There’s still a way to go. We’re now making plans to electrify our market and wholesale deliveries while monitoring the development of infrastructure to support electric HGVs for Shipton Mill. In the future we also hope to dive deeper into our Scope 3 emissions – particularly in the “purchased goods and services” category – to better reflect the sustainability efforts happening throughout our supply chain.
Our work also has a ripple effect. Through our markets, social media, and public-facing messaging, we raise awareness of the links between food, farming, climate change, and displacement. We show our customers and community that small everyday choices – like choosing organic bread or cutting food waste – can make a big difference.